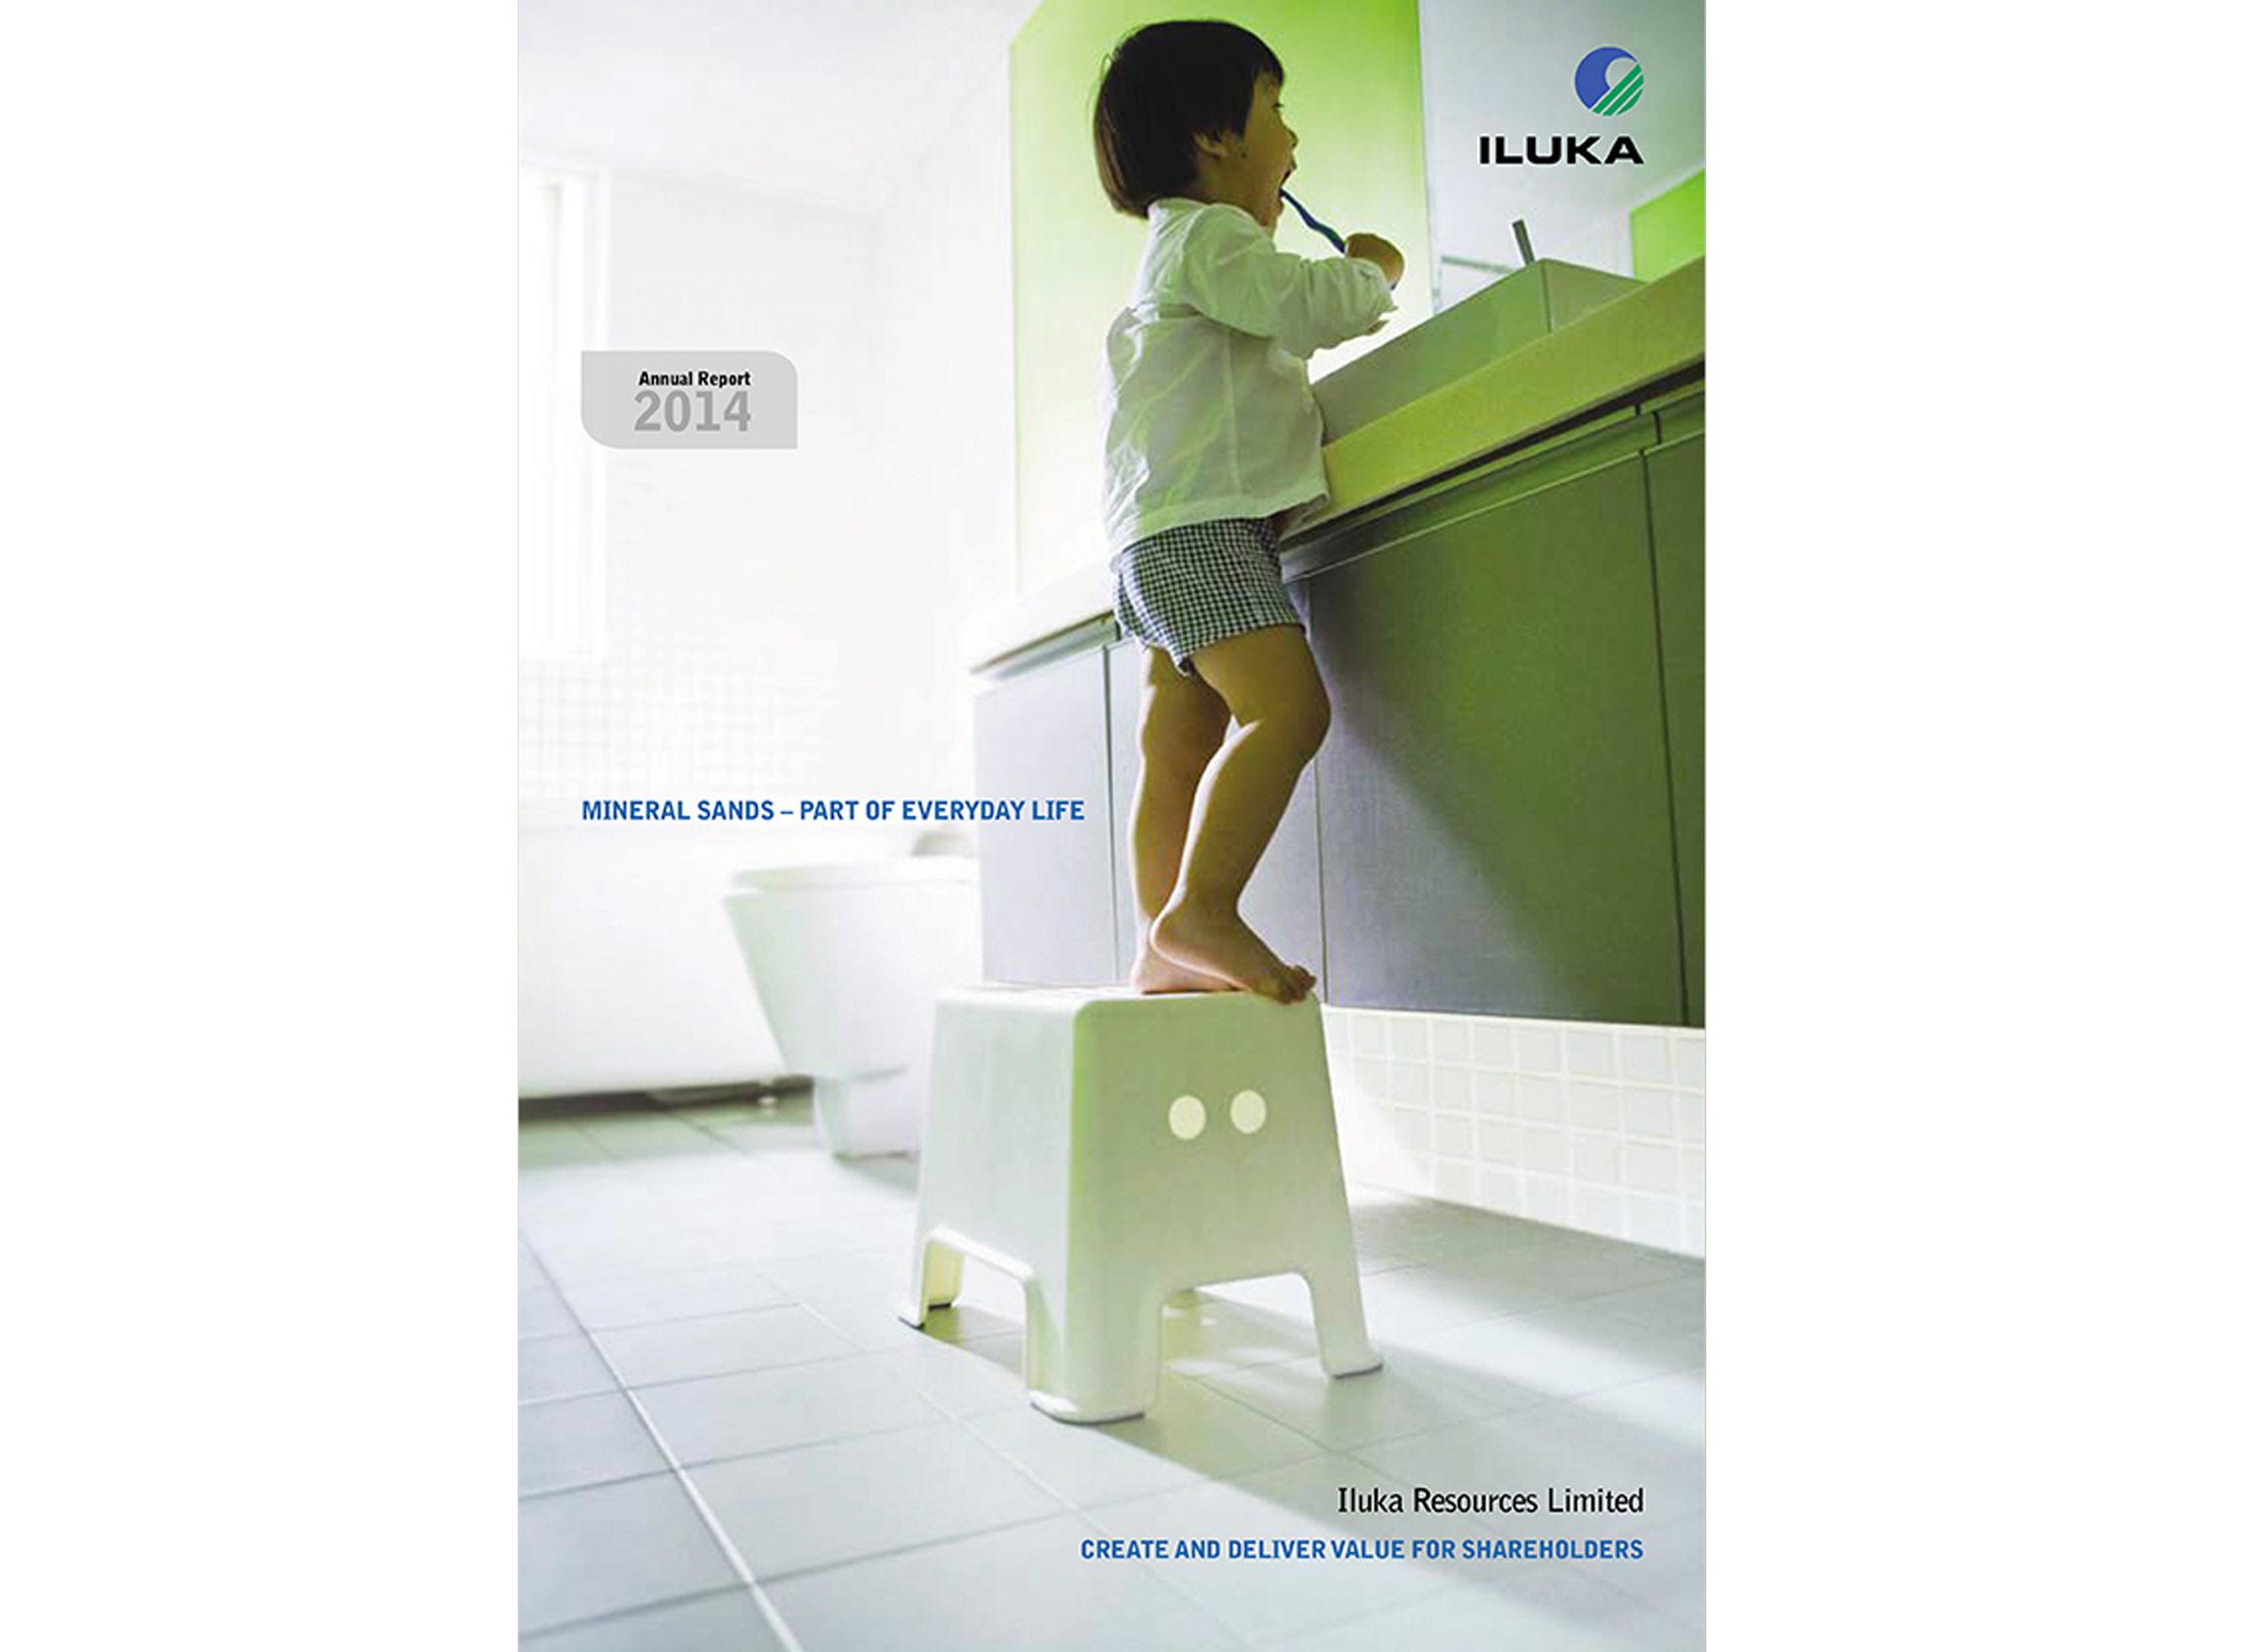
THE FOUNDATION OF OUR DESIGN PROCESS IS TO UNDERSTAND YOUR KEY REQUIREMENTS FOR YOUR ANNUAL REPORT:
- KEY AUDIENCES AND THEIR INFORMATION REQUIREMENTS
- BUSINESS PRIORITIES, BUSINESS AND FINANCIAL OUTCOMES (PARTICULARLY RELATIVE TO PRIOR YEARS OR MARKET GUIDANCE)
- CORPORATE POSITIONING REQUIREMENTS, SHORT AND MEDIUM TERM
- BRANDING AND CORPORATE IDENTITY REQUIREMENTS
FROM THIS INFORMATION AND OUR DISCUSSION WITH YOU WE ARE ABLE TO DETERMINE THE STYLE AND NATURE OF THE ANNUAL REPORT EXECUTION THAT MAY BE APPROPRIATE AND, WITH THIS, HOW THE STRUCTURE, LAYOUT AND VISUAL REPRESENTATION WILL BE ALIGNED WITH WHAT THE COMPANY IS SEEKING TO ACHIEVE.
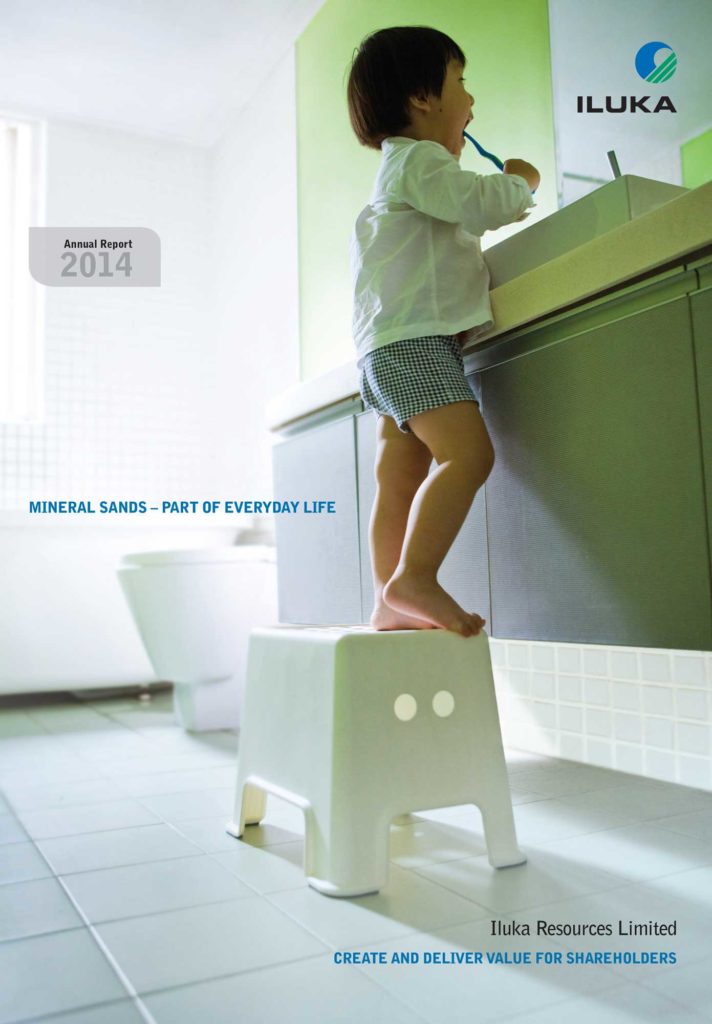
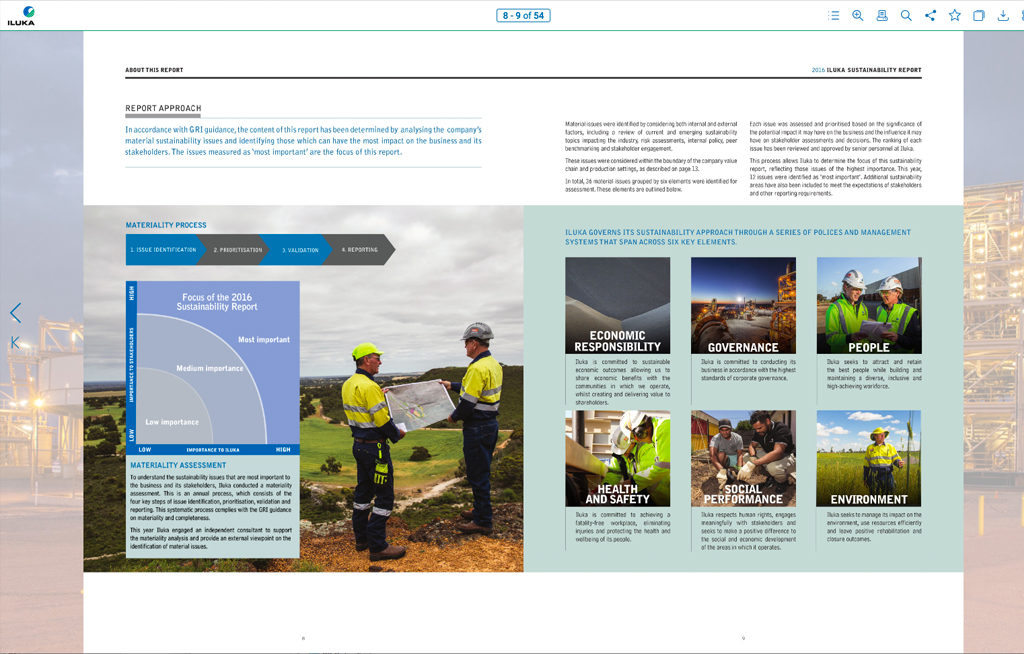
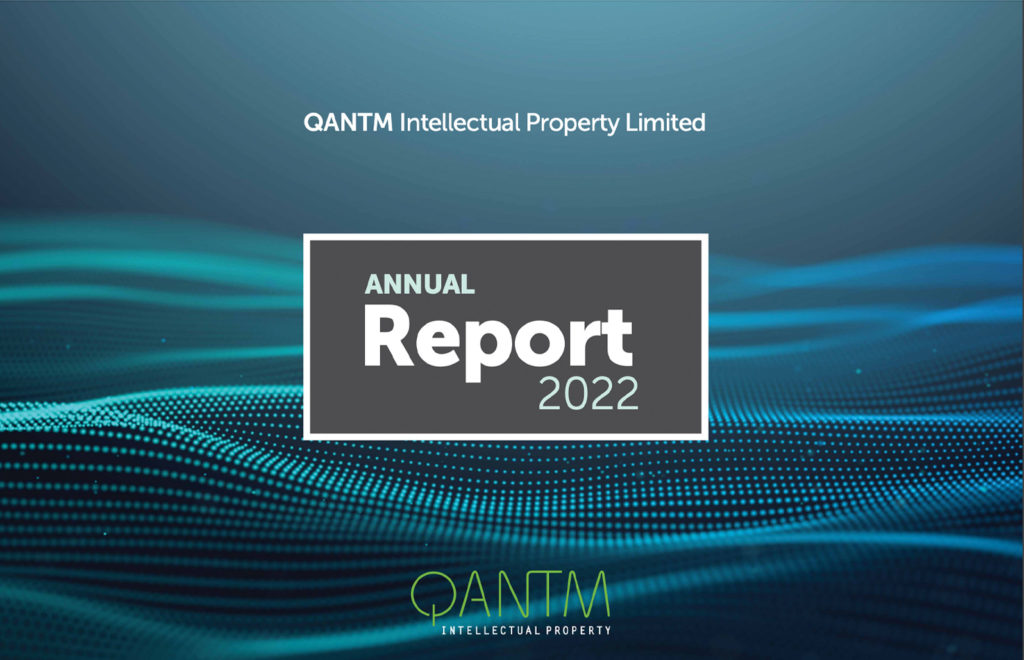
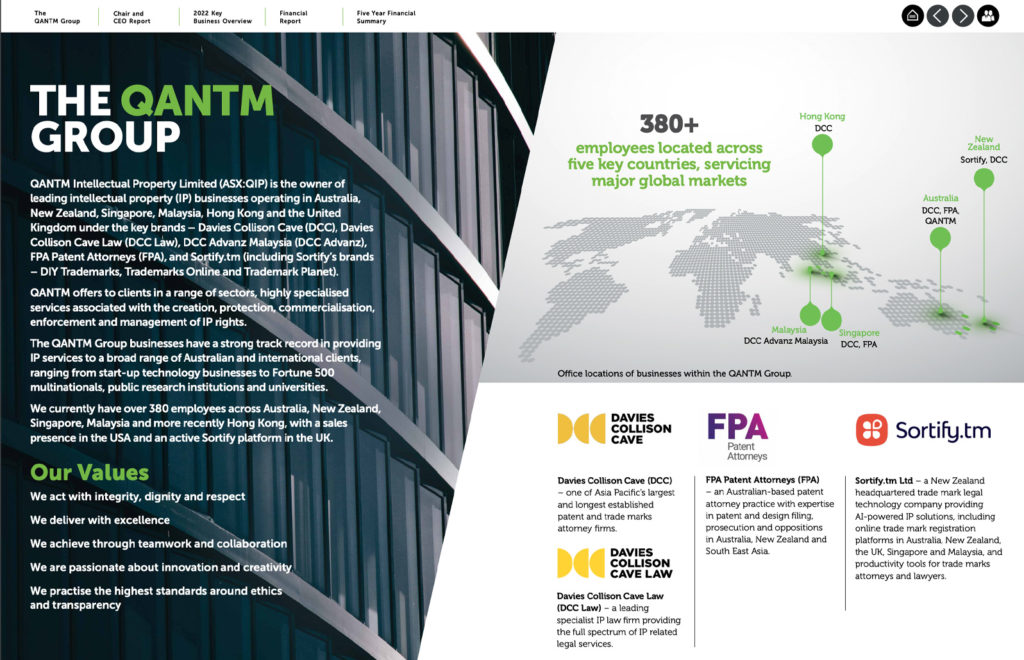
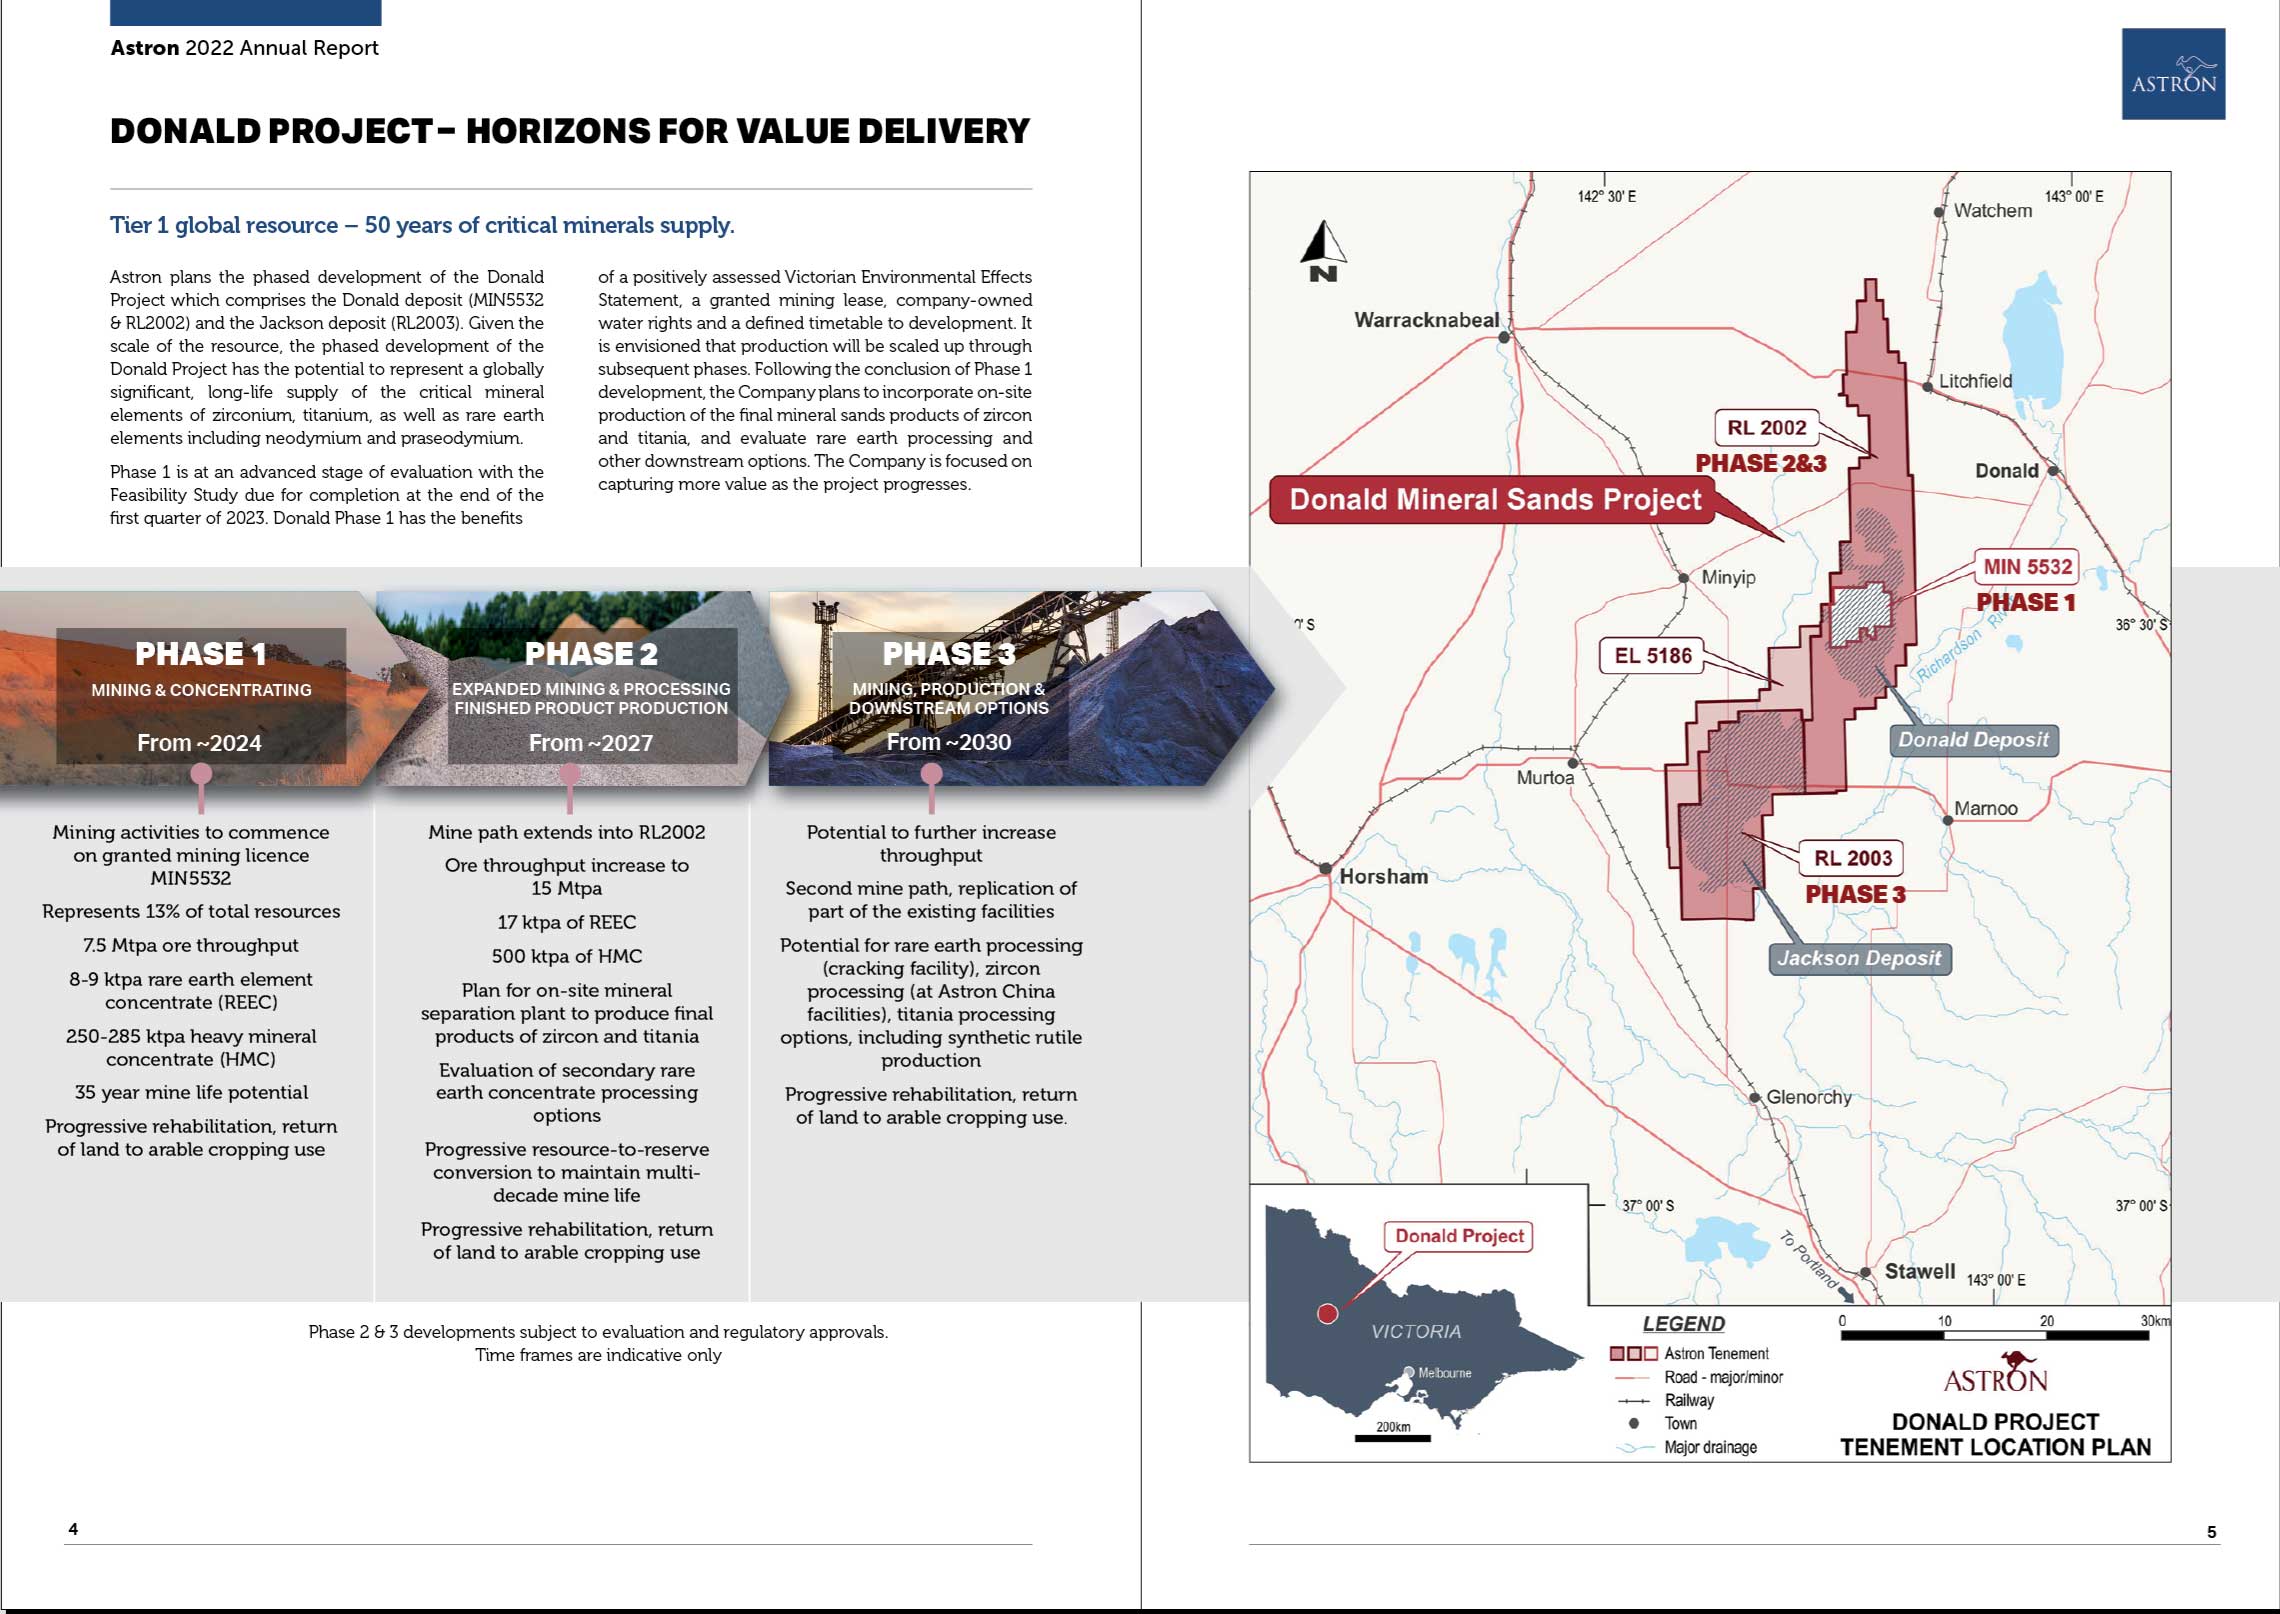
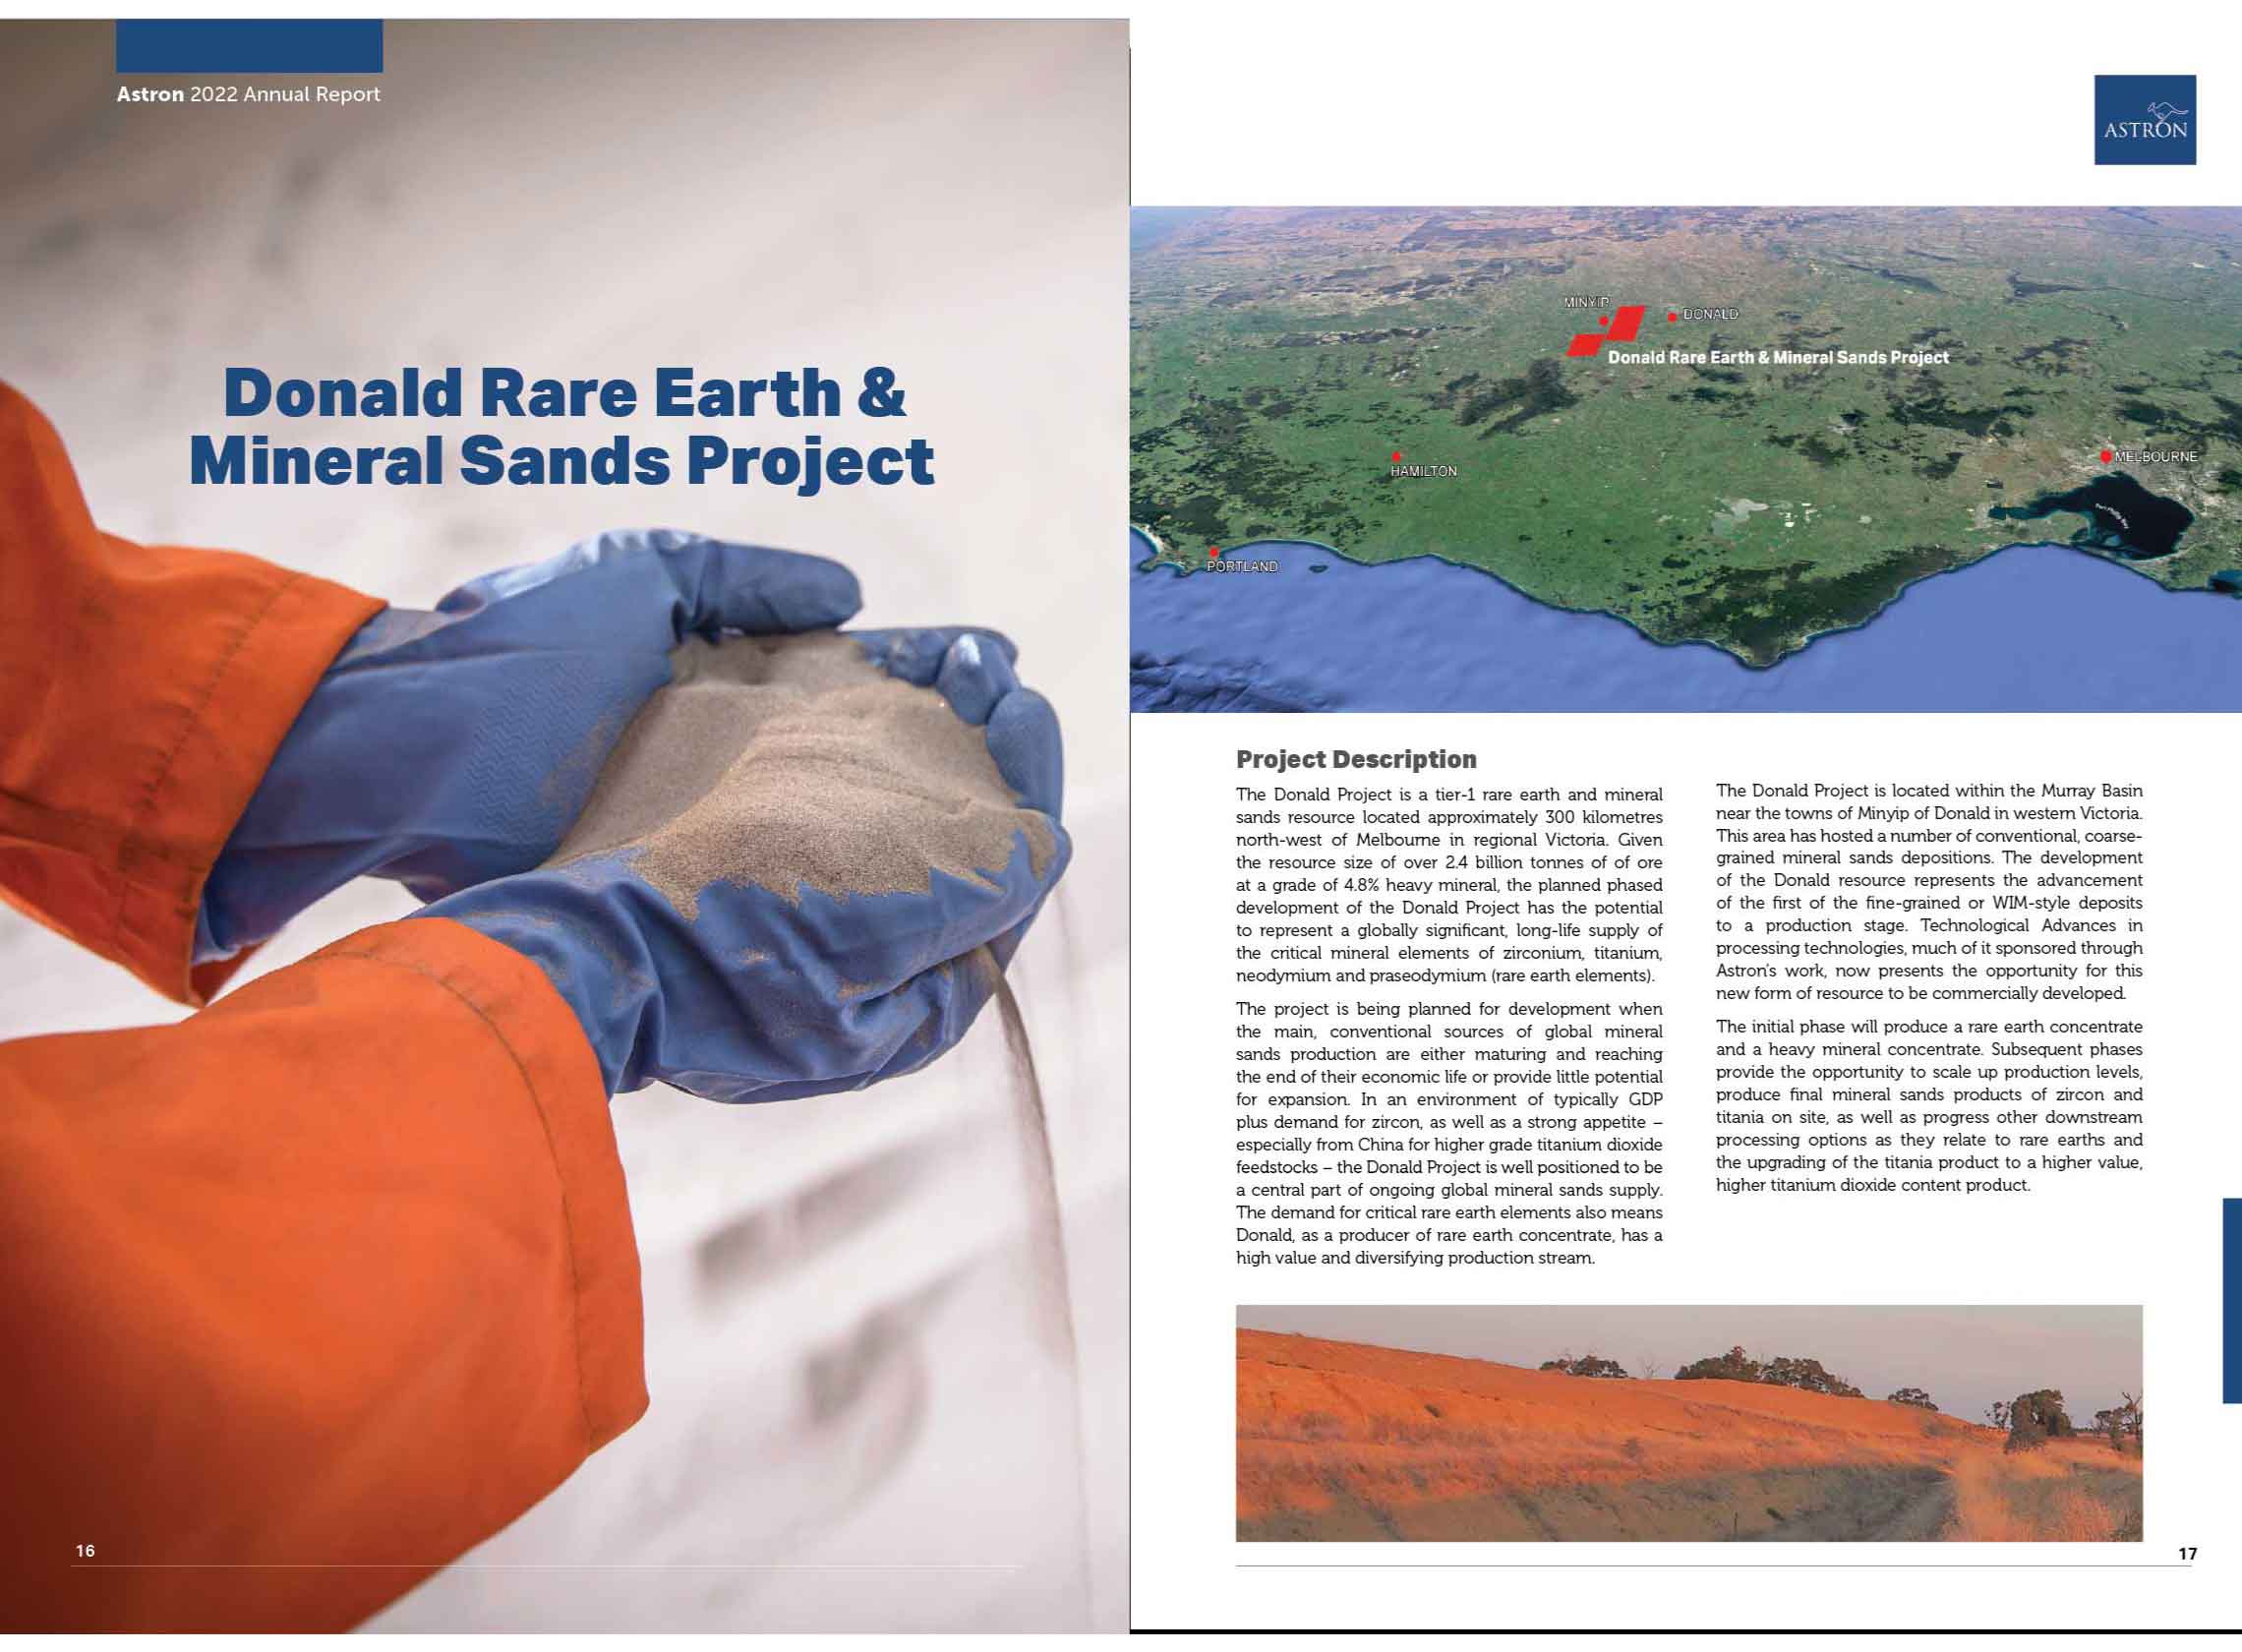
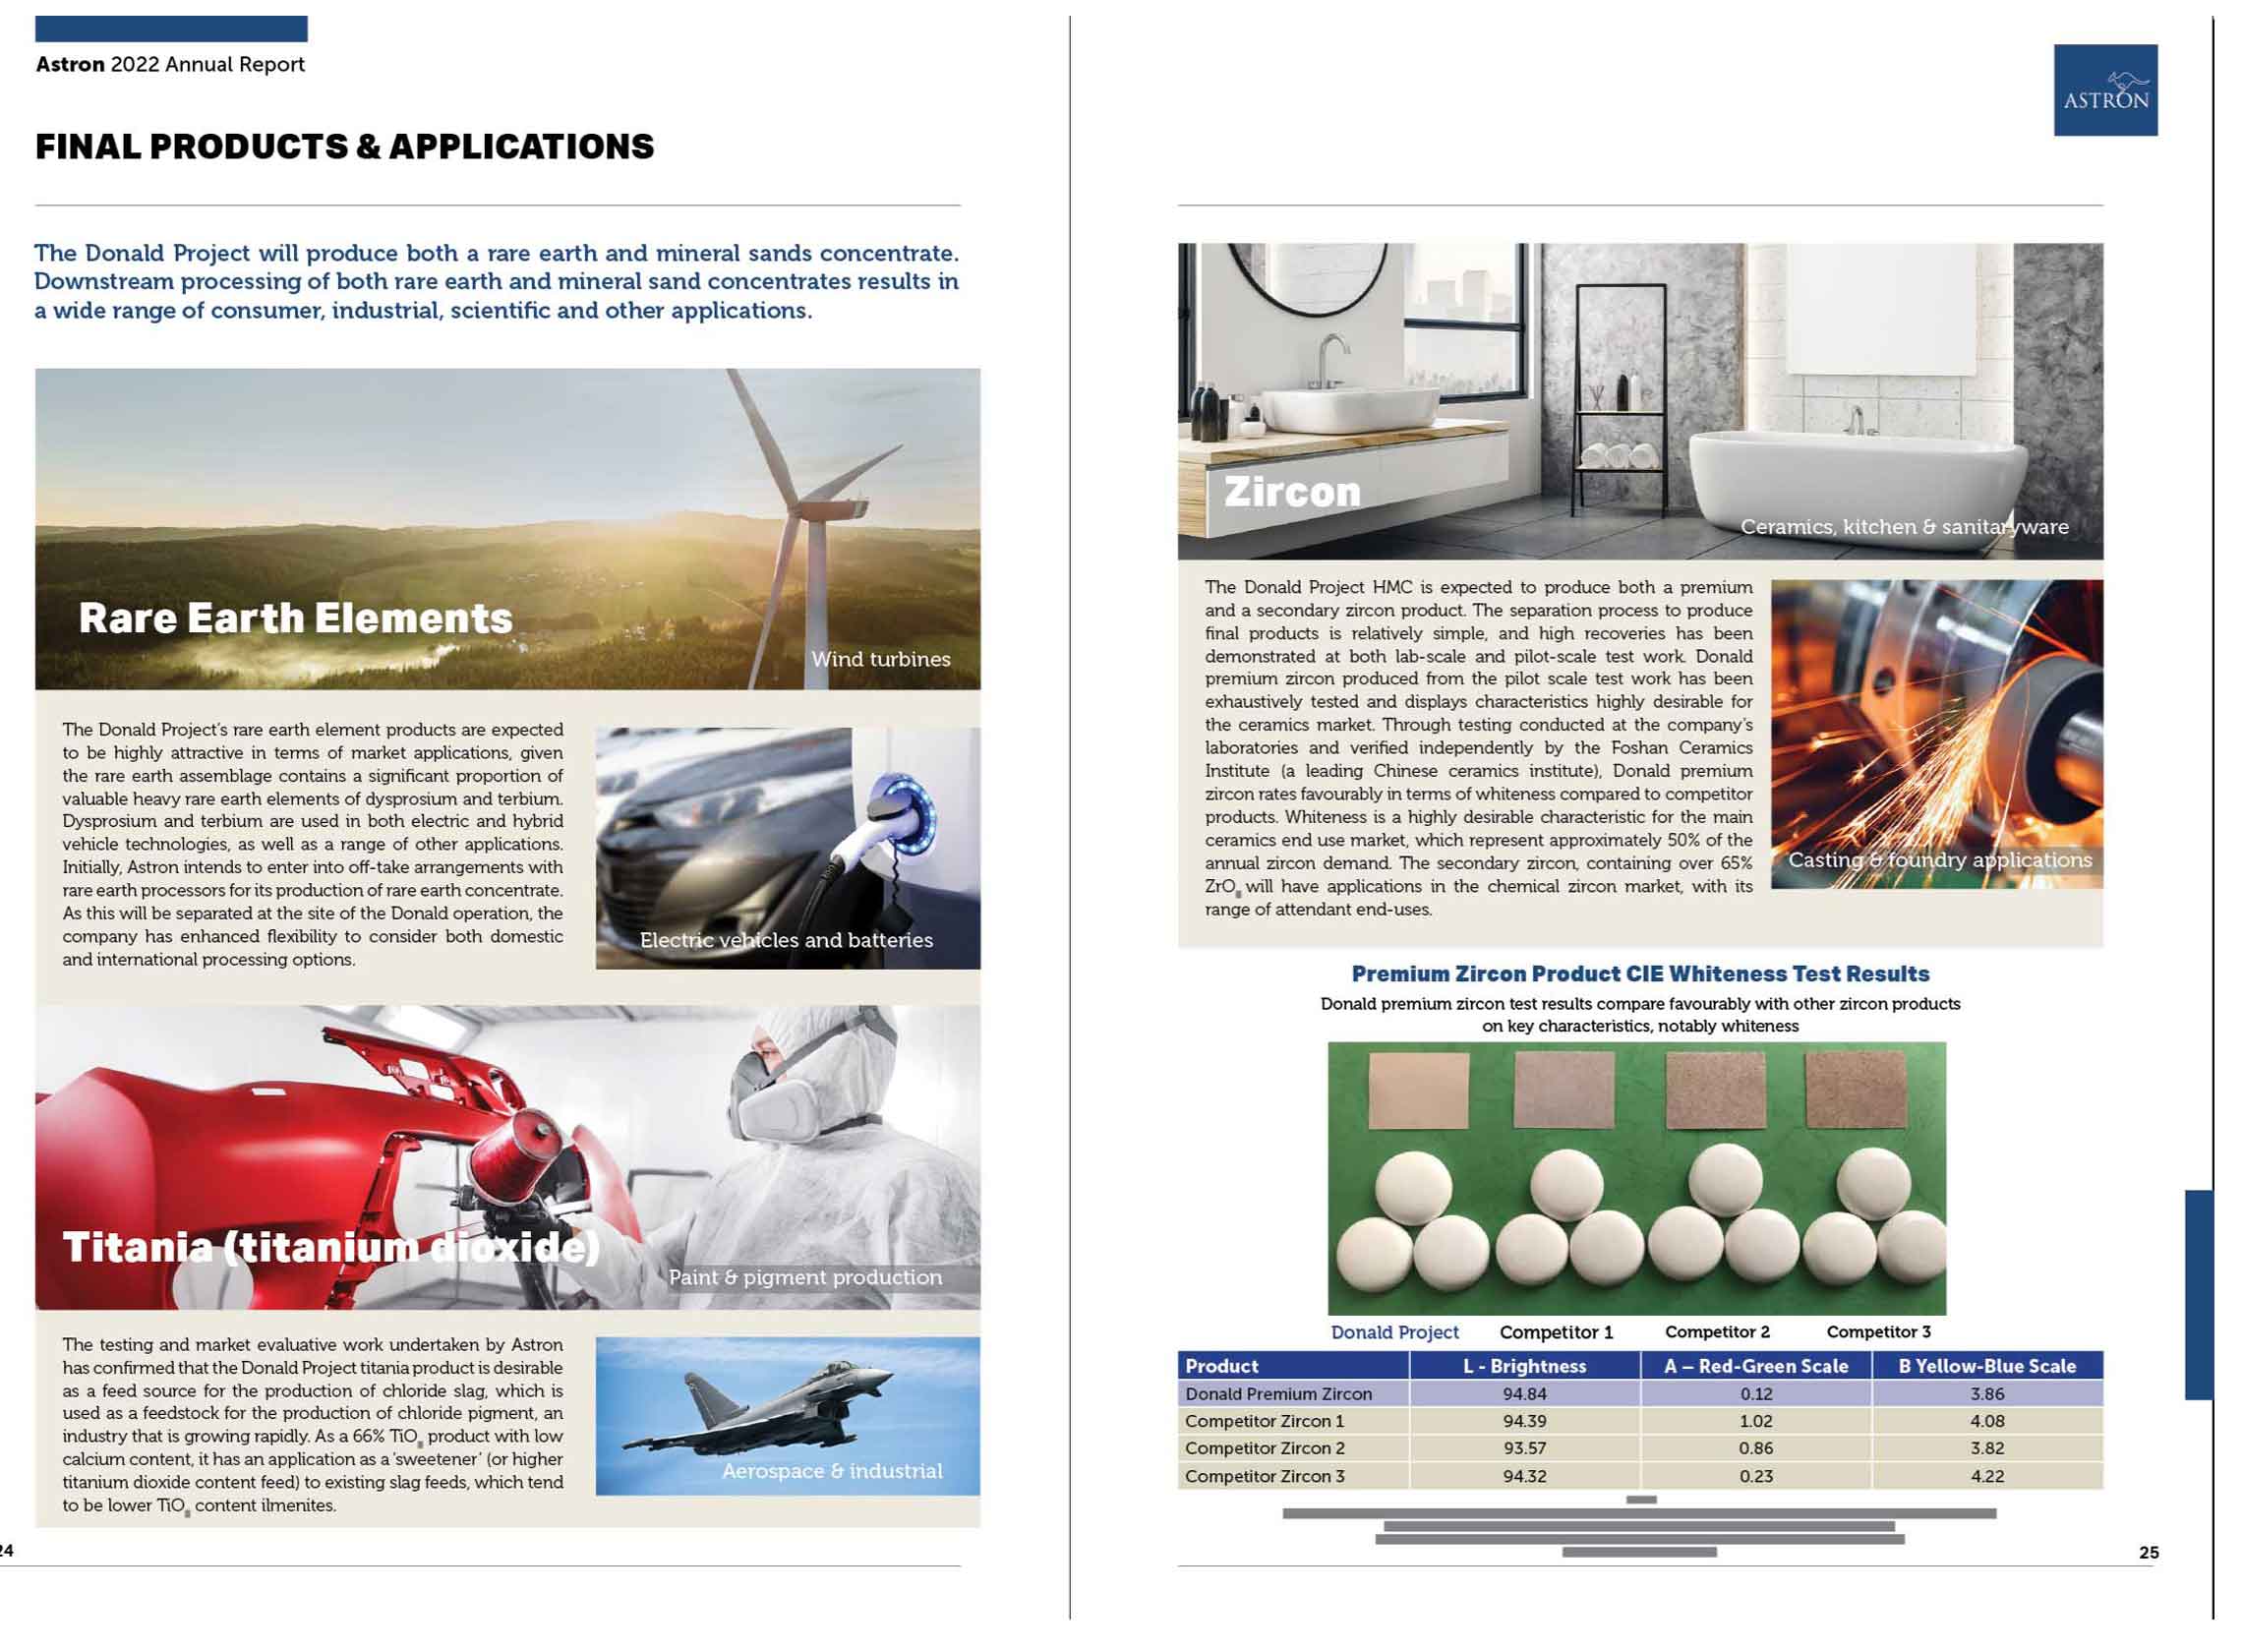
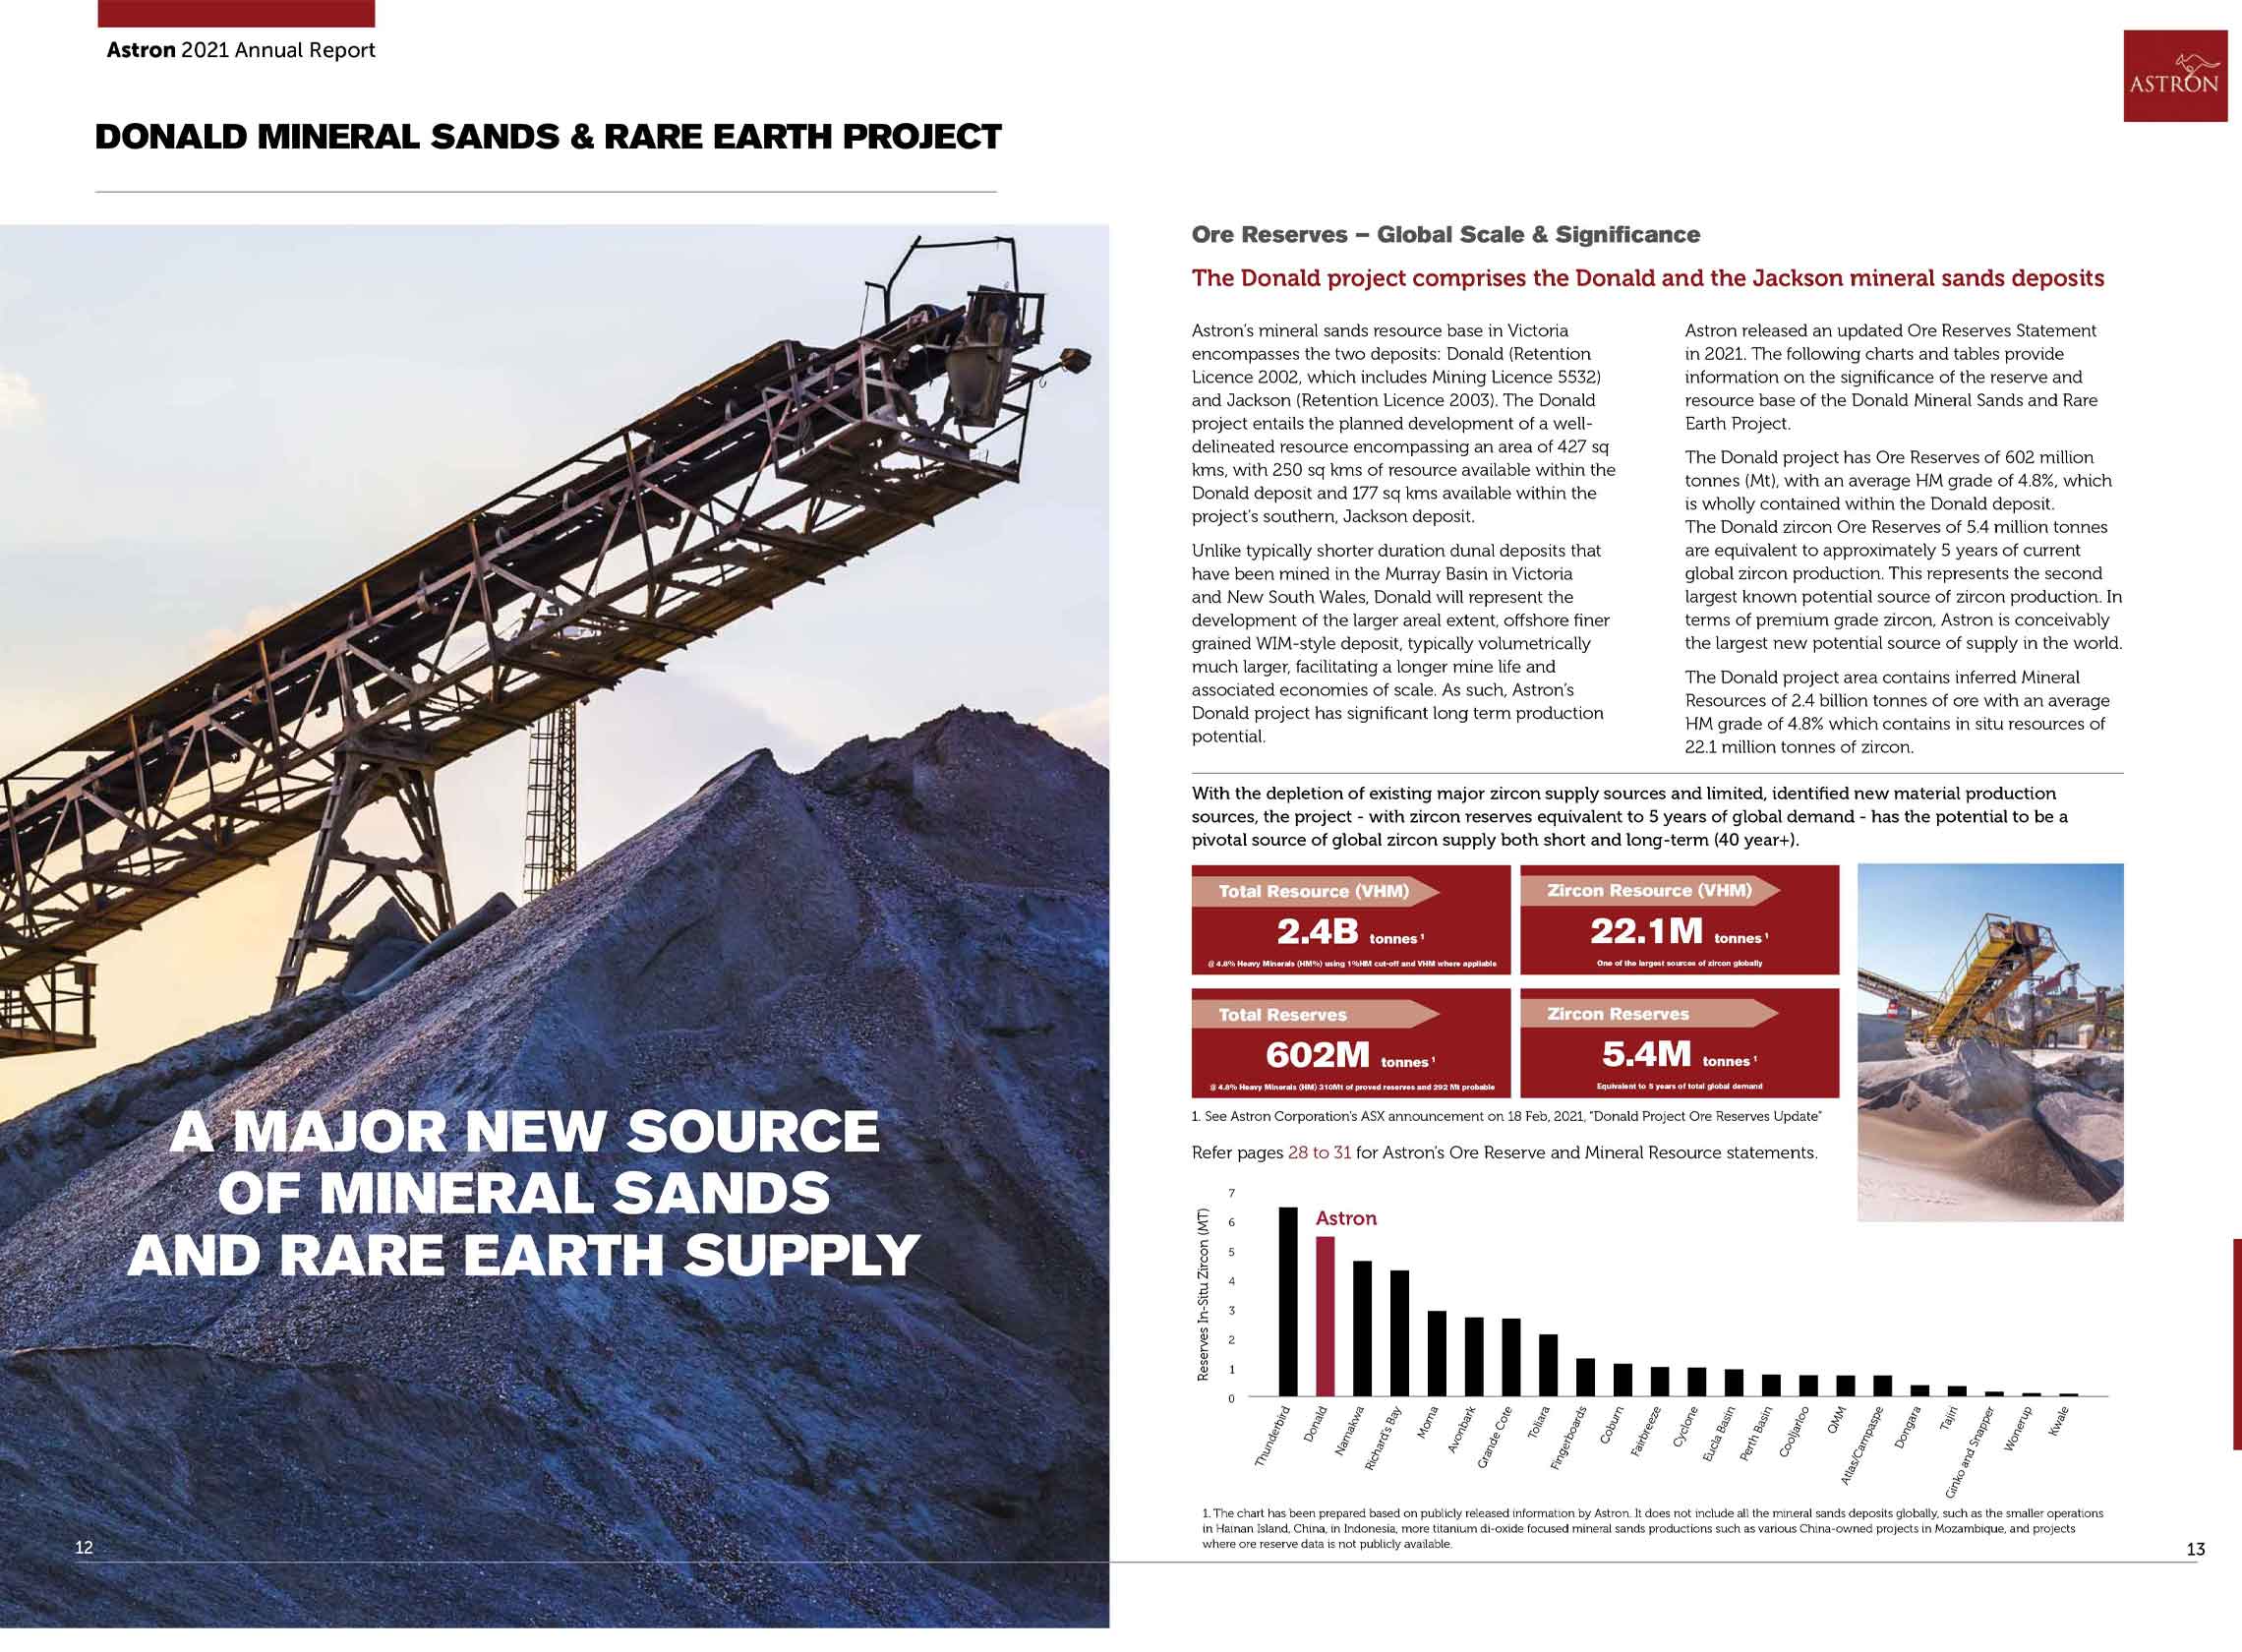
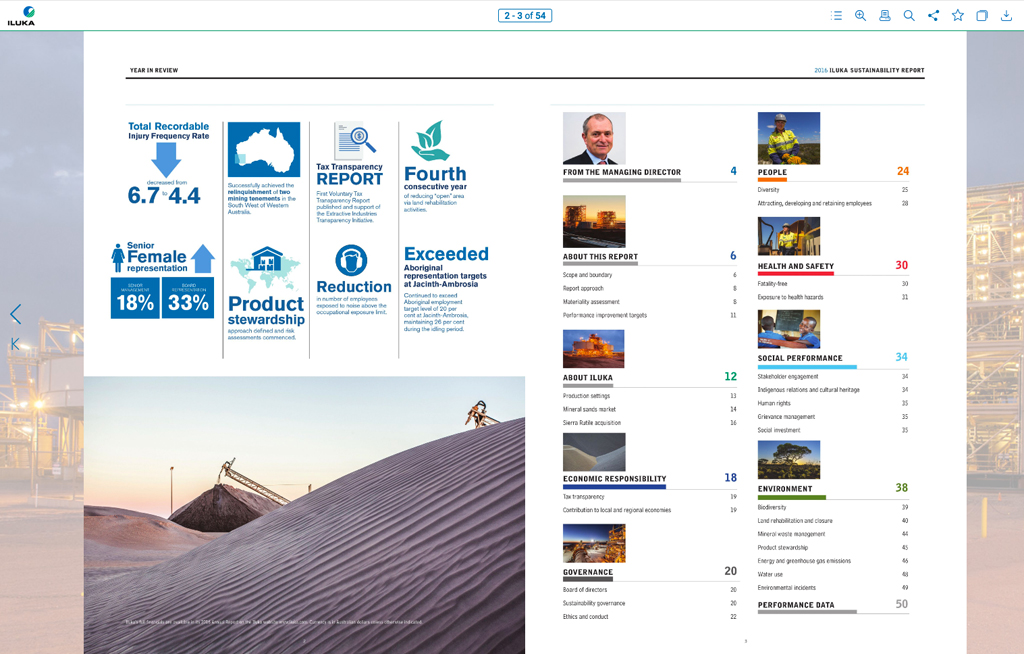
WE THEN DEVELOP CONCEPT DIRECTION STORYBOARDS THAT INCLUDE FRONT COVER, OVERALL PAGE VISUAL STYLE, CHARTS, DIAGRAMS, INFOGRAPHICS, MAPS AND FINANCIALS.
OUR DESIGN PROCESS IS METHODICAL AND DETAILED. WE UNDERSTAND HOW CRUCIAL YOUR ANNUAL REPORT IS IN TELLING YOUR COMPANY’S STORY.
BEST OF ALL, WITH OUR EXTENSIVE EXPERIENCE IN CORPORATE BRANDING, WE’LL ENSURE THAT THE DESIGN ELEMENTS AND EXECUTION FOR YOUR ANNUAL REPORT ARE ON-BRAND AND CONSISTENT WITH YOUR OVERALL MARKETING MESSAGES AND OBJECTIVES.
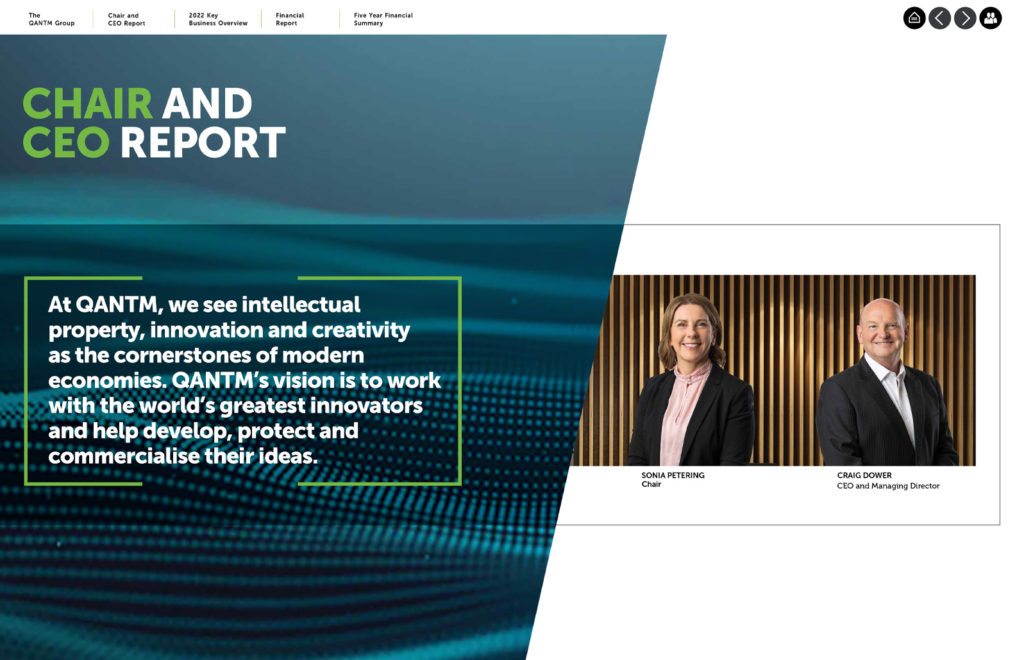
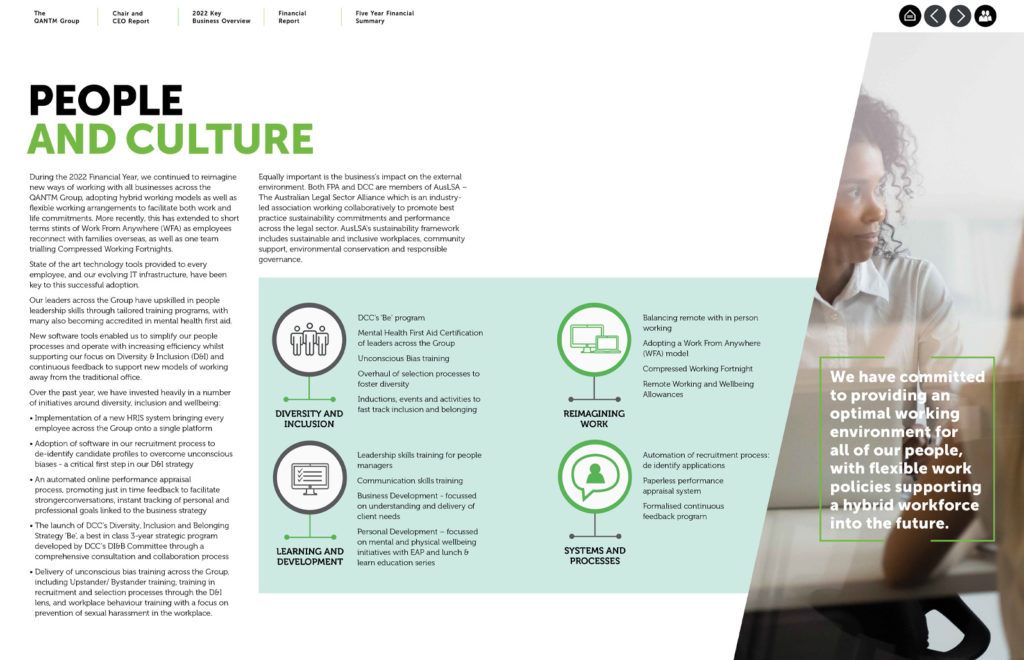
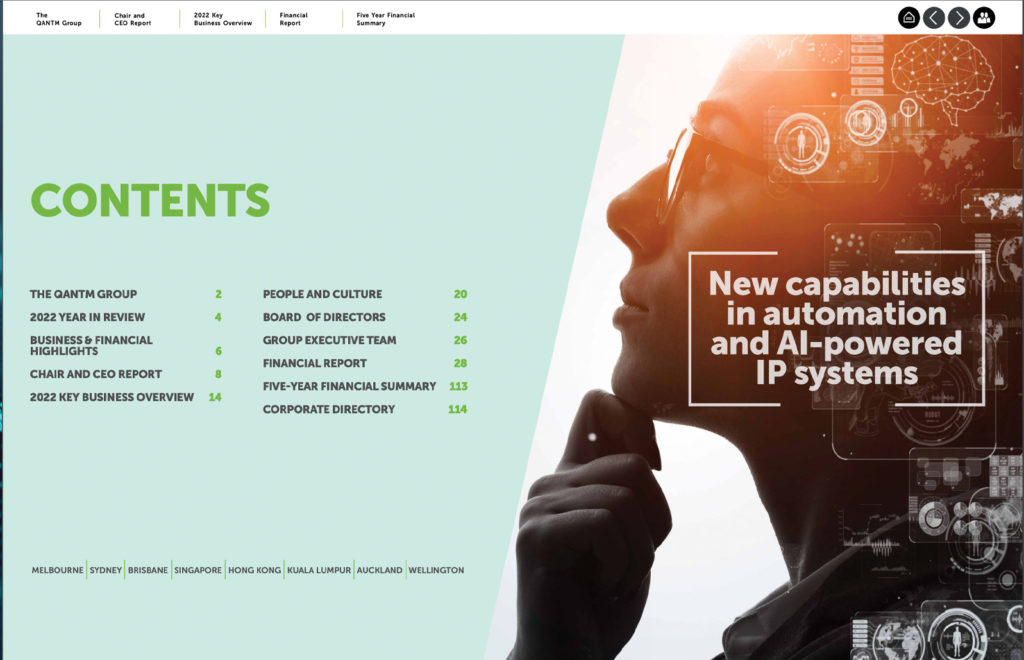
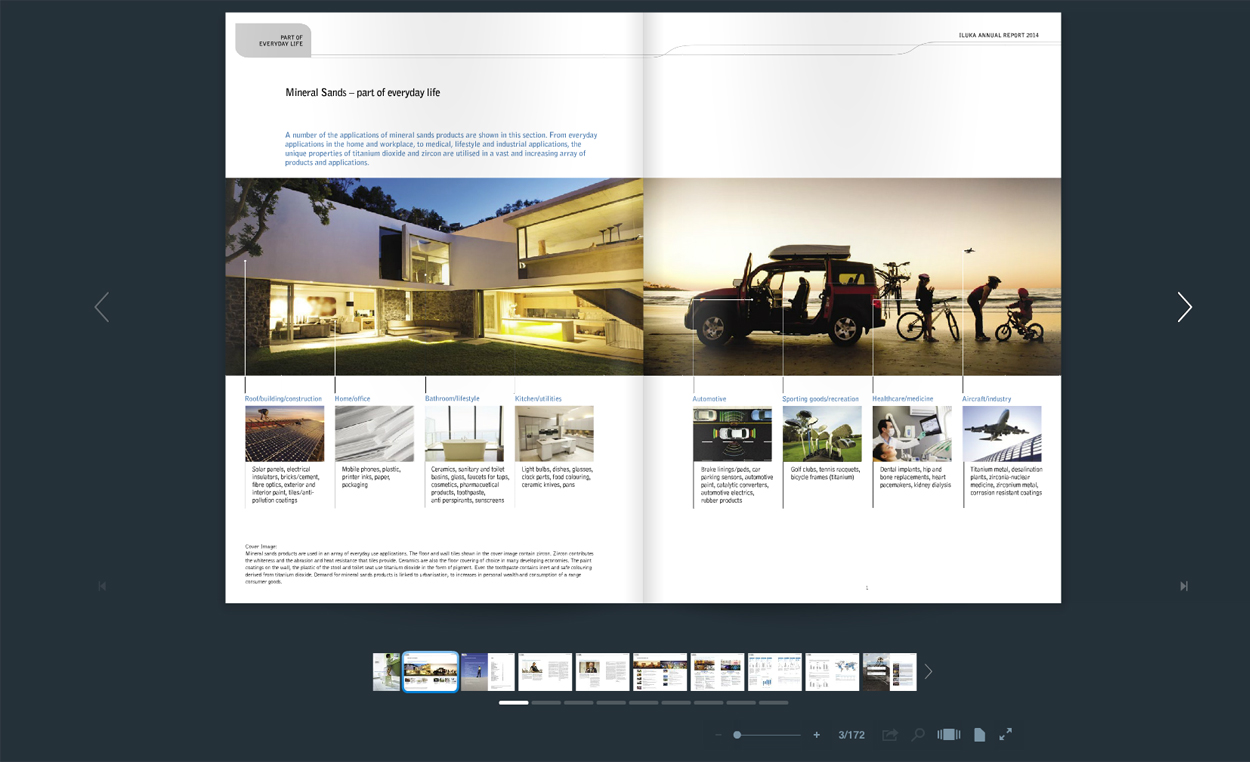
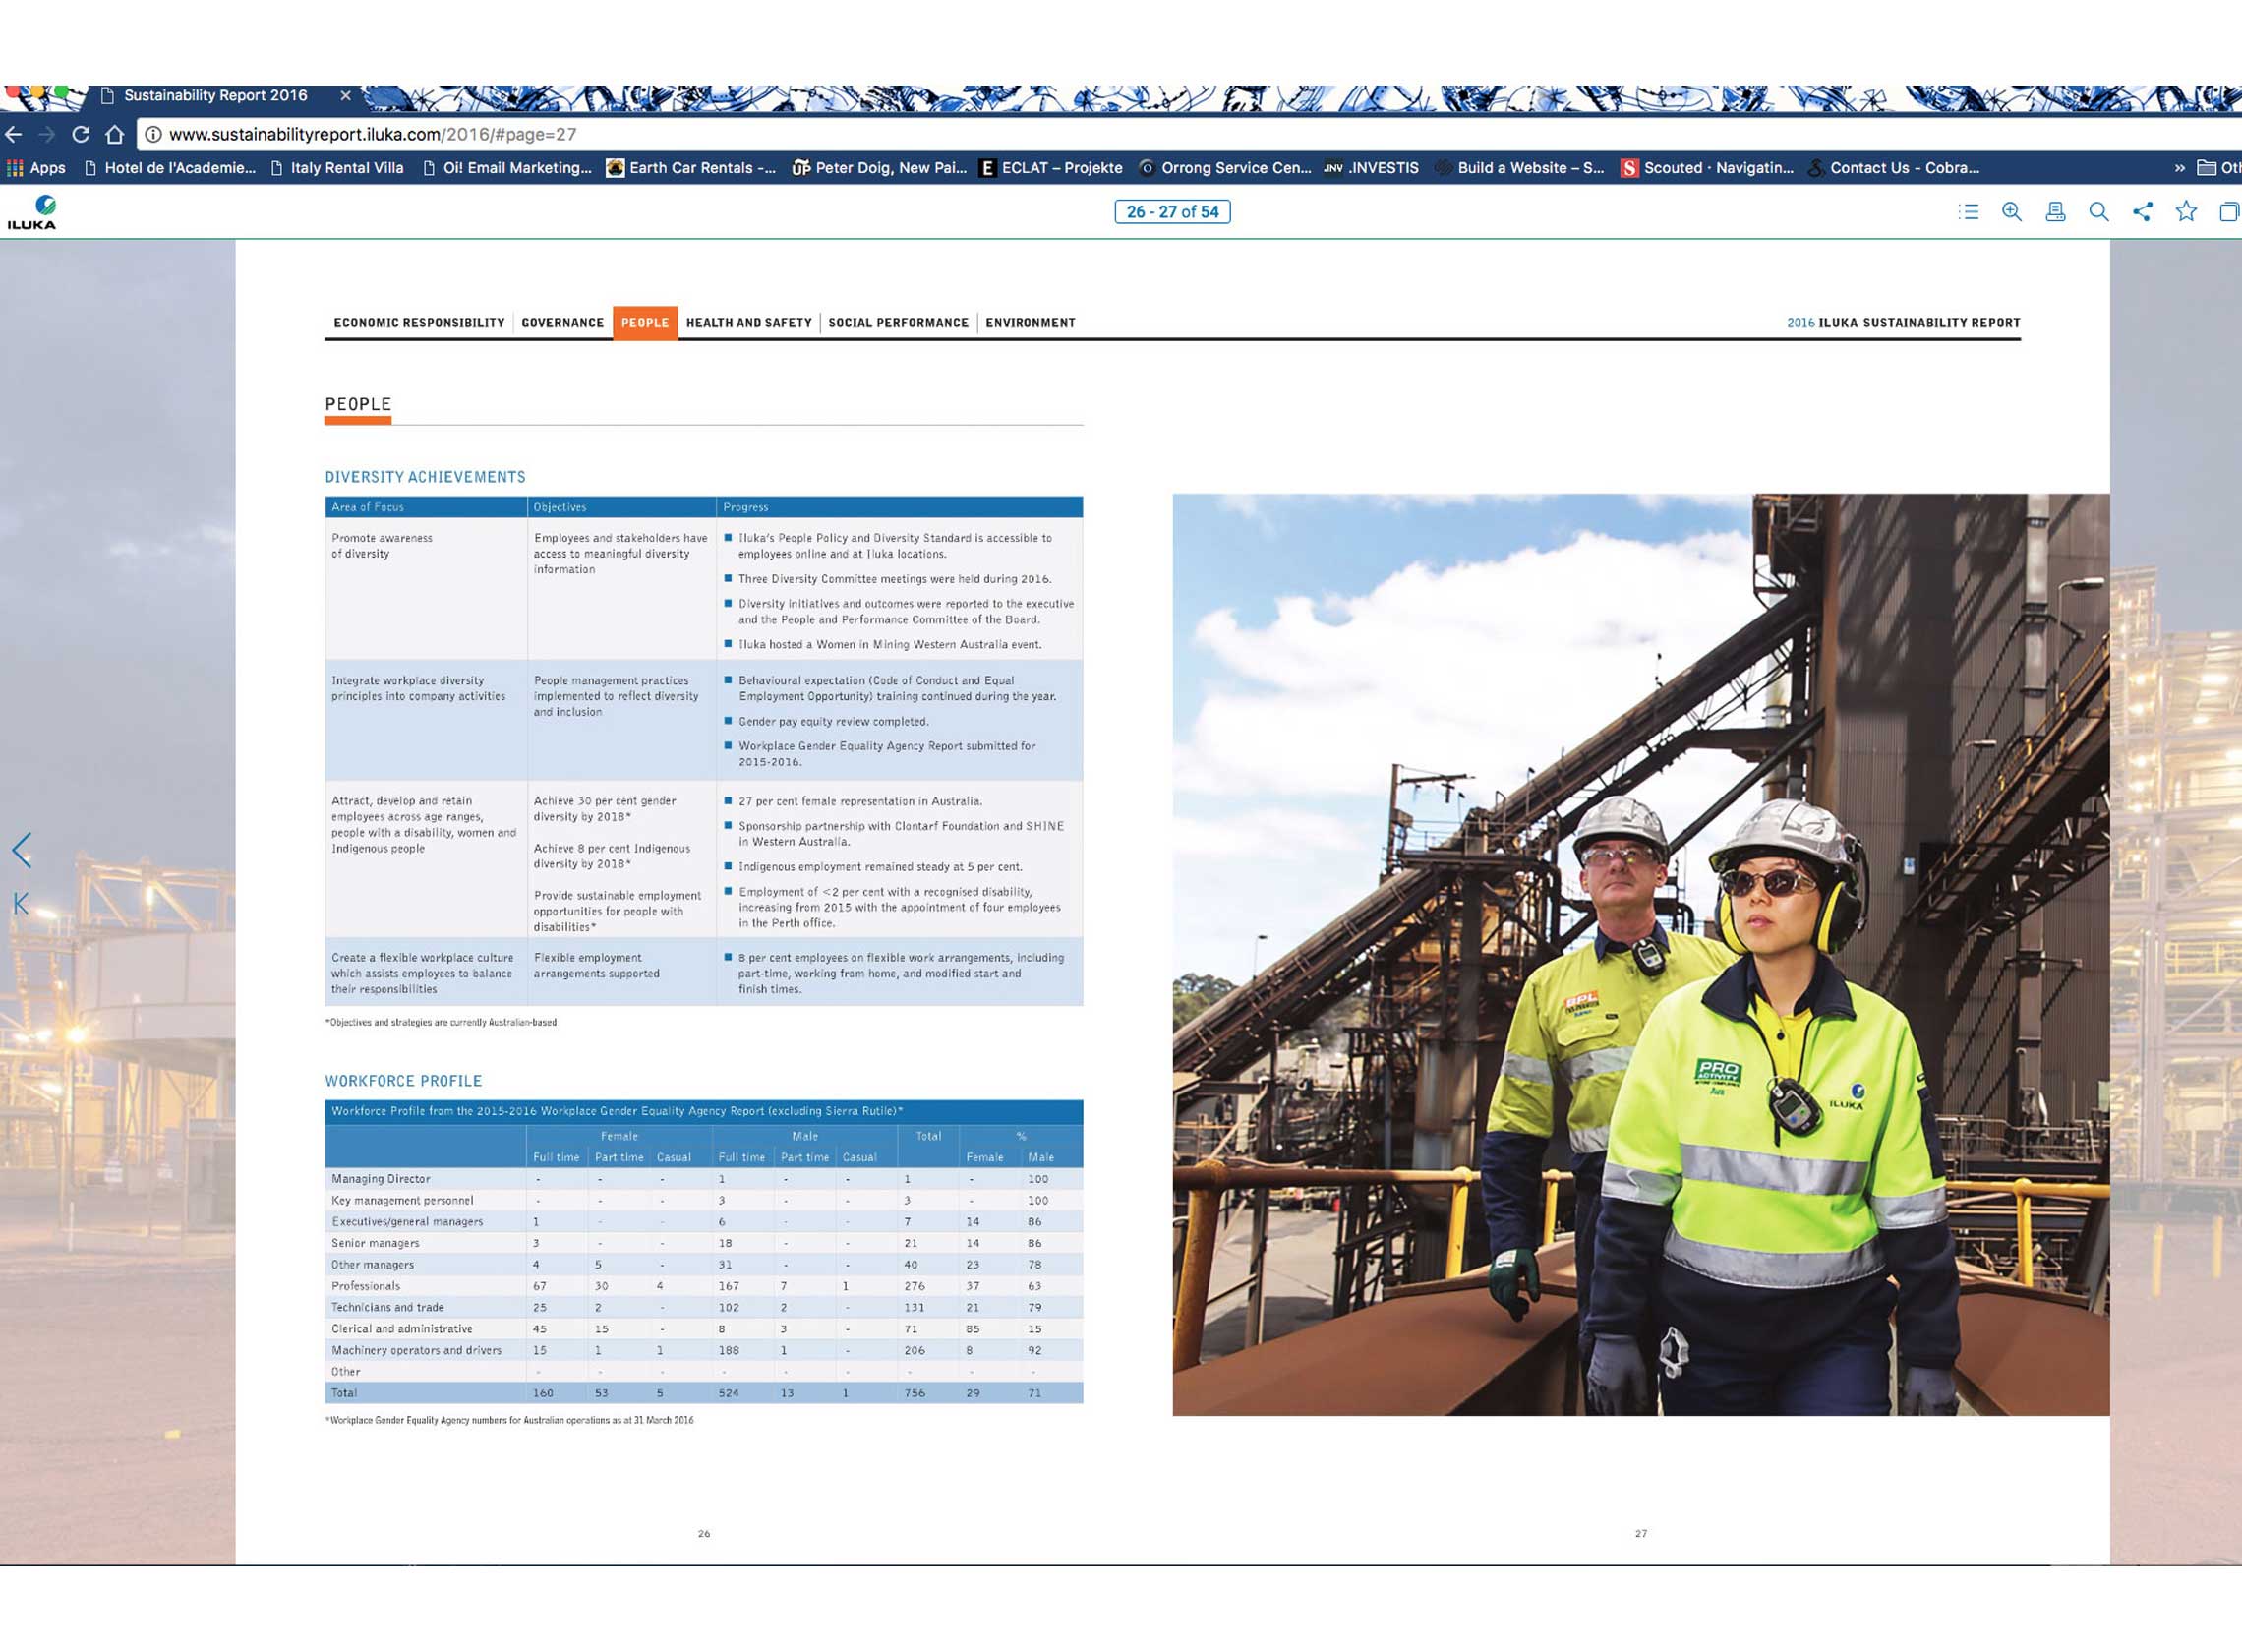
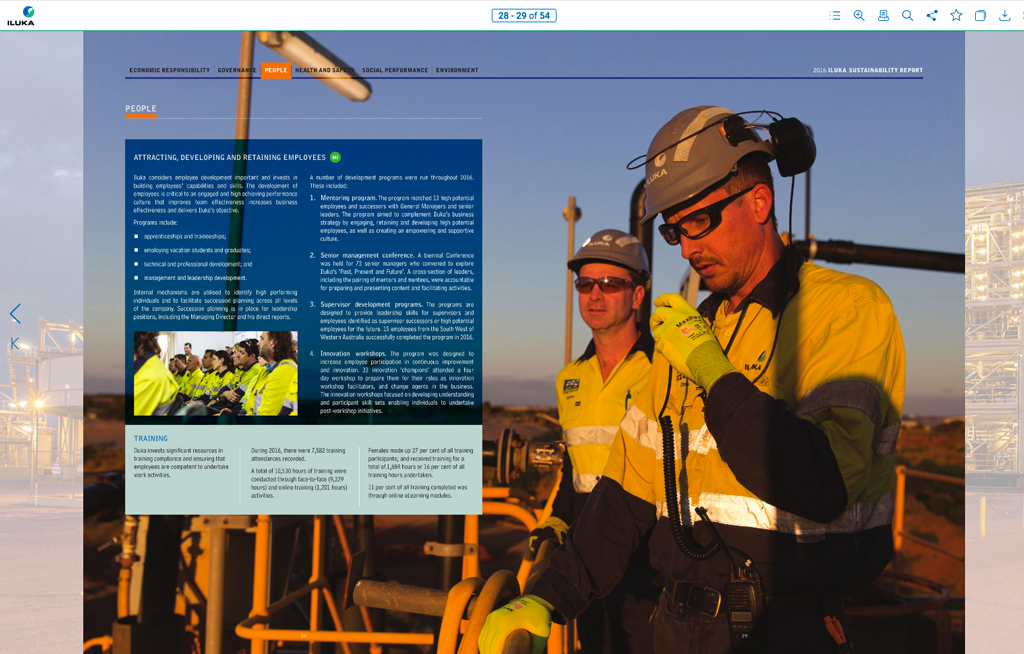
Digital annual reports are a great way to present your annual report in a compelling and interesting way, engaging audiences and turning what is a traditional print execution into a dynamic communication medium.
It’s no surprise that traditional, printed Annual Reports are quickly being overshadowed by digital, interactive versions that are not only more engaging, but are an avenue to rapidly increase your readership and overall ROI.
More businesses are now investing in creating digital Annual Reports as more readers turn to digital platforms to consume their content. Annual Reports can be dramatically transformed to become digital marketing assets that come with all the added benefits that digitalisation offers – direct CEO and Chairmen messages, videos of operations, interactive tools, downloadable spreadsheets and so on.
Going digital also enables the ability to see who is reading your report content, when and from what device. This data is invaluable if you wish to continuously improve your reports performance year on year.
Data visualisation:
Turn your data from static to dynamic with data visualisation. Your digital report allows you to bring to life the data that matters, highlighting it to your readers eye in an engaging way. Digital also allows you to bring depth to your data with links to inspiring blog posts or other related content.
Dynamic content:
You can embed videos, create audio elements, use animations and interactions as an alternative way to show your story as opposed to telling it in slabs of text. This makes it easier for your reader to digest what you have to say. It also keeps your reader engaged for longer.


